NOOR UN NISA

Aspiring Data Analyst | BI Developer
ABOUT ME
Hi! I'm Noorunnisa (also known by Noor) , currently focused on upskilling and building visualizations that drive business decisionsA fast learner, with experience working with teams and a drive to create impact!I'm eager to seize every opportunity that comes my way and dedicate myself fully to making the most of it.Scroll down to find more about me and my projects!
MY SKILLS

Power BI /Tableau | Excel | PowerApps | Virtual Agent | Power Automate | Python | SQL
Scroll down to the experience and achievements section to see my soft skills in action :)
FEATURED PROJECTS
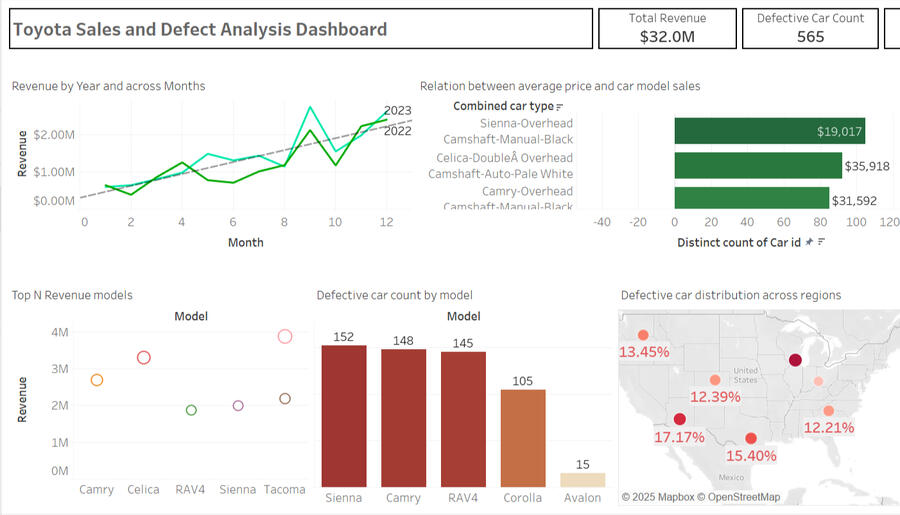
Tableau | WEKA
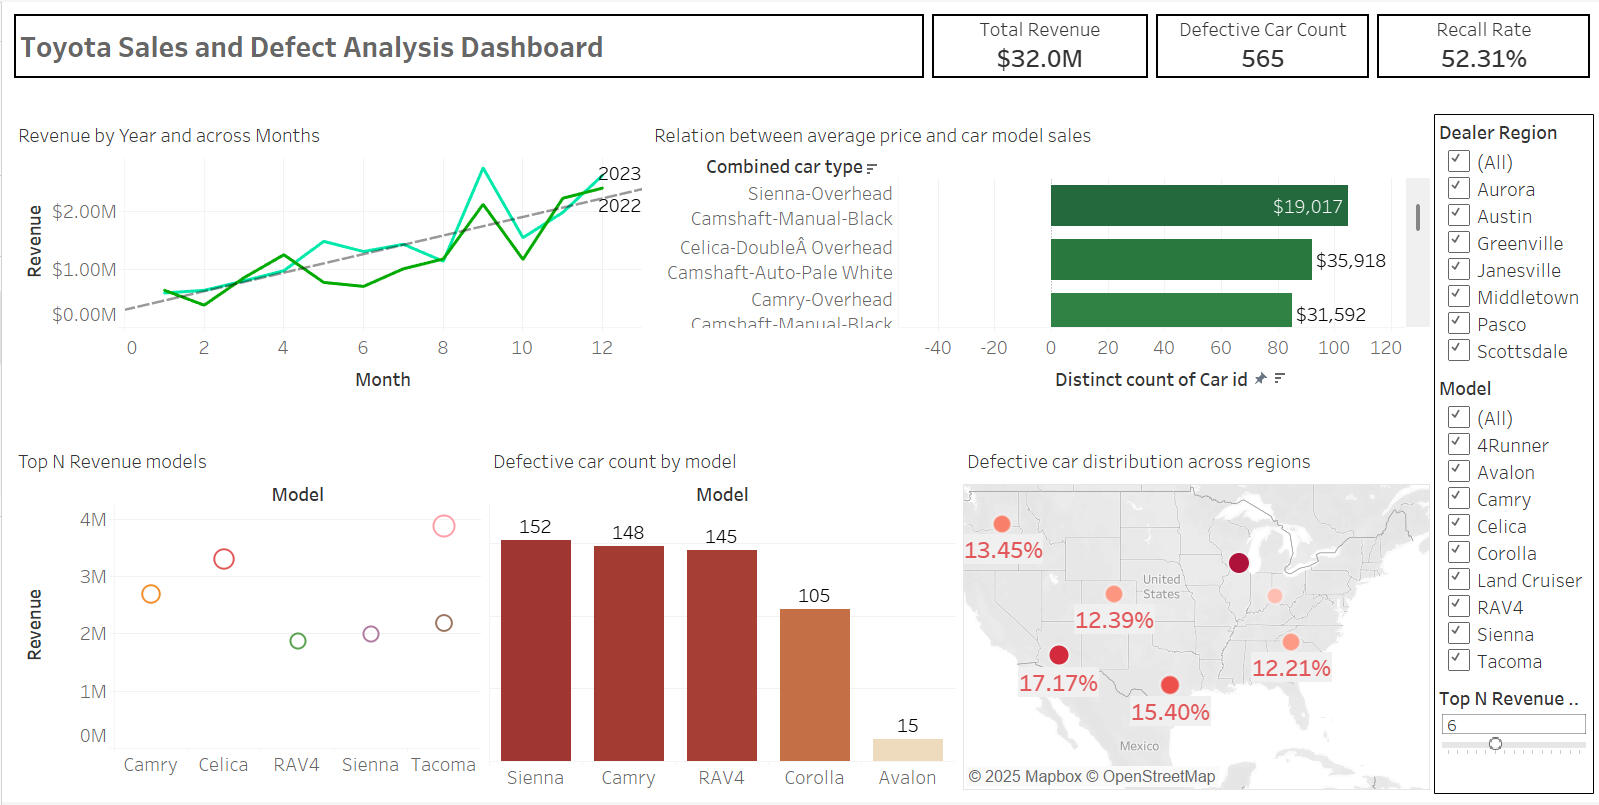
Sales and Defect Analysis Dashboard
Conducted end-to-end data analysis for an automobile company, leveraging ETL, OLAP, cloud-based data warehousing, Tableau visualizations, and data mining to extract key business insights.
Power bi | Power query
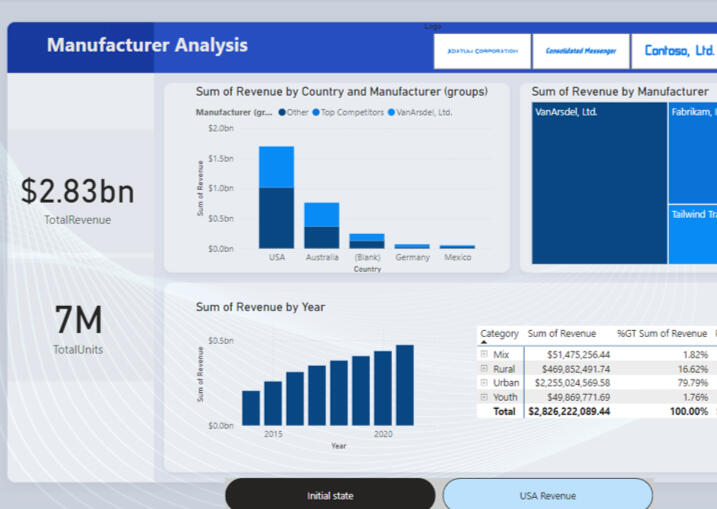
Manufacturer Analysis
Developed an interactive Manufacturer Analysis Dashboard for a fictional company, leveraging data visualization to track growth trends, market performance, and competitor analysis.
EXPERIENCE
The aim behind these ventures is to learn, grow and contribute by collaborating with experts!
Junior BI Consultant
Cherrie Business Solutions
June - July 2024
Conducted Power BI training for their clients, focusing on interface navigation, data visualisation, and dashboard creation, introducing the team with the potential of PowerBI
IT Support & Sharepoint Developer
MCN (MiddleEast Communications Network)
Aug 2024 - Present
Ensured device compliance through updates and security patches, supporting the company’s Zero Trust Architecture goals.
Designing and developing a SharePoint knowledge base to educate users about technology, leveraging PowerApps and other Microsoft tools to deliver an interactive and accessible resource hub.
~ At University level ~
Giving back to the student community
Head of Backend Development
Middlesex Computing Society
May 2024 - Present
Hosted Debugging 101 session demonstating practical techniques to debug any code.
Conducted summer study group sessions with hands on practice in backend technologies.
ACHIEVEMENTS
2024 Recipient
of
Generation Google Scholarship for Women in Tech (EMEA)
2024 Attendee
of
Power BI Certification Bootcamp by Beinex and InsightsxLab
2023 Runner up
of
GDSC Ideathon (Inter University Sustainability Solutions Competition)
AUTOMOBILE SALES AND DEFECT ANALYSIS
To put my knowledge into practice, got hold of a automobile dataset (here car sales and defect data) from KaggleAim
To analyze the impact of airbag-related model recalls on regional sales and identify key areas for strategic focus.
Here are the key questions I was interested in answering:1. Which car models have the highest defect counts in each region?
2. How should the company prioritise regions to manage the impact of defect cases?
3. Which transmission type is more prone to defect?
4. How has revenue performance evolved over the months in 2022 and 2023?
Here is a jist of my approach to creating the data reportThe first step I did was to understand the organization and conclude on the data strategy they can use, considering they have both structured and unstructured data generated during their operations- Evaluated their transition to a cloud-based data warehous
- Researched and mapped out their ETL process
- Performed in-depth business data analysis using OLAP
- Identified the most suitable big data and cloud computing technologies
Next to do the actual analysis, I conducted data preprocessing in Excel, removing nulls and standardising columns for further analysis in Tableau. (see dashboard above)
Here are my key takeaways from visualizations created to answer the business questions1.The Sienna has the highest defect count, with Janesville (19%), Scottsdale (17.17%), and Austin (15.4%) reporting the most defects, requiring targeted recall efforts.
2. Manual cars show higher defect rates than automatics.
3. Revenue peaks in Janesville ($5.8M), Austin ($5.4M), and
Scottsdale ($4.9M), especially in Q4. These insights can guide marketing, improve dealer efficiency, and enhance customer satisfaction.
Finally, performed data mining to identify correlation between the dataI am using a supervised classification algorithm to identify patterns between input features and the target variable, Defect_status (defective or not defective). A decision tree will be built using the J48 algorithm, which implements Quinlan's C4.5 for optimized tree generation.
Initially, including the 'Model' attribute led to 100% accuracy caused by overfitting, as 'Model' directly correlated with Defect_Status.
To enhance generalization, 'Model' was excluded, resulting in a reliable model accuracy of 95.13% and a Mean Absolute Error (MAE) of 0.0672, providing effective defect prediction and valuable insights for quality control improvements.